
Introduction
On my developer work, there are some tools that make my job much easier and I use them on a daily basis and miss them when I go to a computer where I don’t have them. To create code, I think that there’s no better tool than Resharper (see my article about it here). For debugging code, the equivalent is OzCode (http://oz-code.com/). I’ve been an OzCode user since its early betas (it was called BugAid, at those days), and it’s been improving from version to version, and its features are really valuable when debugging an app.
Using OzCode
When you are creating a program, you won’t see anything about OzCode, but as soon as you start debugging your program, OzCode appears and start to shine. One of my favorite features there is what they call Reveal (but I call this “Show me what I want”). Here’s the problem: if I have a list of items and I open it, all I see is something like this:
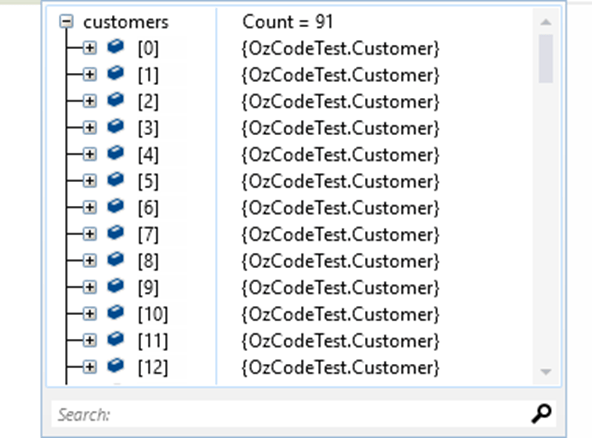
This is not what I want. As you can see, I have a list of 91 customers, and what is shown is the ToString evaluation of each one (“OzCodeTest.Customer”). I’d like to see what’s in each one of these customers and search for the ones I want. You may argue that I can create a ToString override and show what I want, but that is not intuitive, and I may change my mind while debugging (at the beginning I want to see the Id and Name, but in the middle of debugging I want to see the Name and City). And what about to find which one is located in London?
With OzCode, this is solved by simply opening one member and clicking on the star near it: the member is “favorited” and is shown in the list:

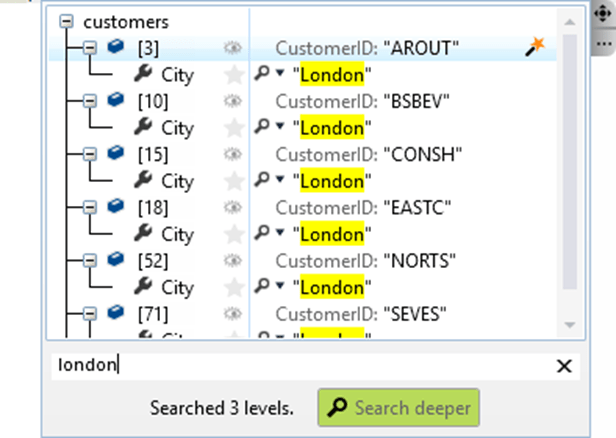
And what about searching? You just have to type in the search box and all items that match the search are shown:
If you want to create some special data, without having to create a new member, you can do so: just click on the magic wand besides the object and select “Add custom Expression”. Then, you can type the expression you want, and put the name of the new “member” after a double slash, like a comment:
[obj].City == “London” // IsFromLondon
And it will appear on the list of members, where you can even make it as a favorite: 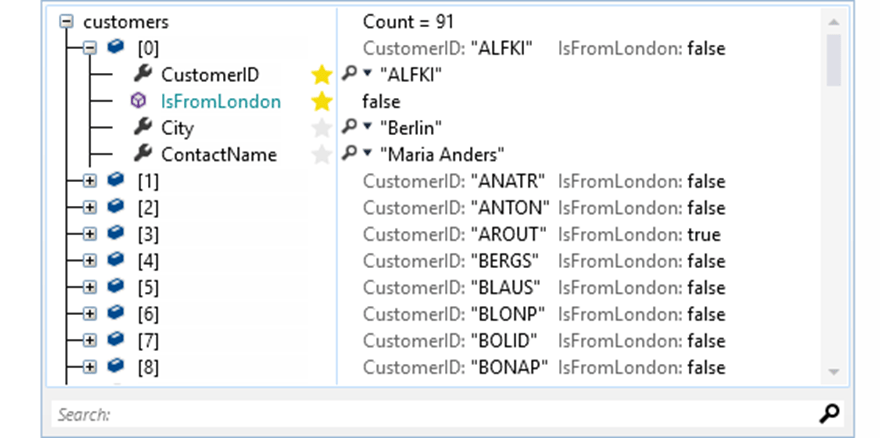
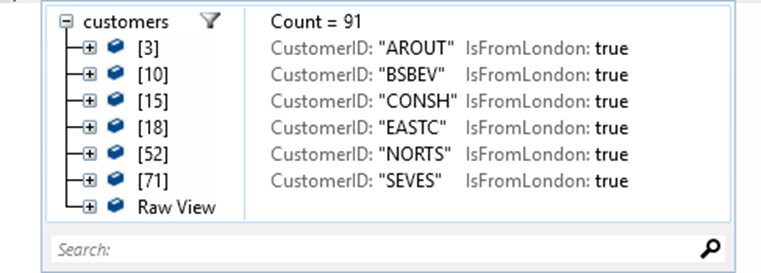
And if I only want to see the customers from London? Just click on the magic wand and select “Edit Filter”. Then, type the filter “[obj].City == “London””. The list of customers is filtered to show only the ones whose city is London:
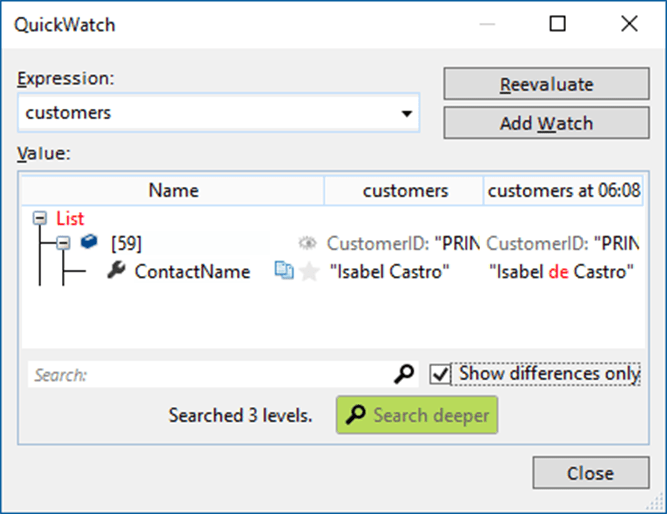
One other thing that you can do here is to compare versions of the two lists: how many times do you need to know what changed between two points in the debugging? It’s very easy to find out. Just stop on the first point and click on the magic wand and select “Compare/Save value”. This will open a window to confirm. Confirm and continue running until the second point. Then click on the magic wand again and select “Compare/Compare with saved value”. A window appears and you can compare the two values. If you want to show only the differences, just click “Show differences only”:
Instant logging
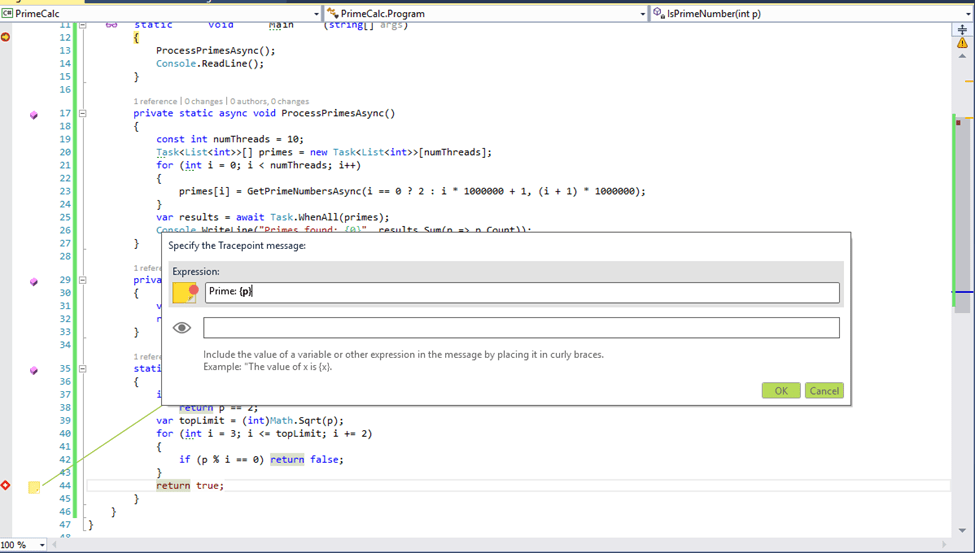
The inspector window on steroids is very nice, but there is more help for our debugging. For me, it’s very common to need some logging in the code, to see what’s happening. I have to add a logging library, add code to log data and then analyze all logs in a separate tool. Too much work and sometimes I miss what I was expecting. So I must add a little more logging, repeat and rinse. Very cumbersome. With OzCode, all I have to do is to select the variable I’m interested, click on the yellow note icon that appears on the left and select Trace value of {variable}. That will add a new trace point that will log the value I’m interested to see.
When you run the program, you can see the number of messages traced in the bottom of the window, near the yellow note.

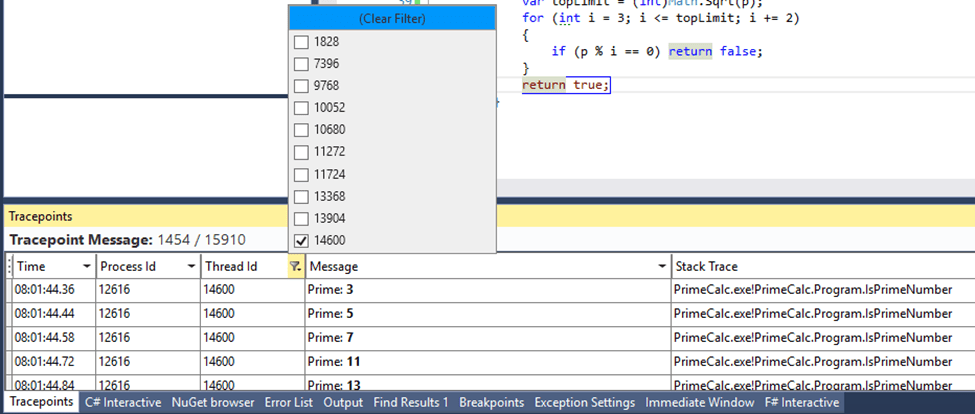
When you stop the program, you can see all messages sent in the Tracepoint viewer window:
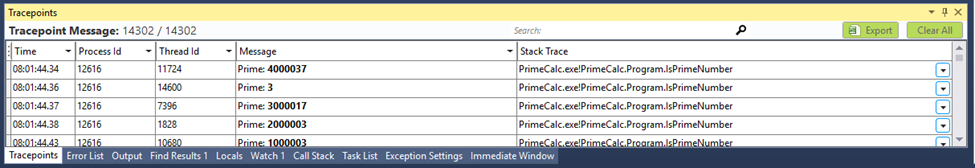
There you can search for something, export the data to Excel, csv or text, so you can have a file to analyze later. Two nice features there are the Thread Id and the Stack trace. Often it’s difficult to debug multi-threading programs, when you go step by step, it’s difficult to follow the code, as the same code can be reached by different threads. If you click in the arrow next the thread Id, you will see from which threads this code was logged, and filter only some of them:
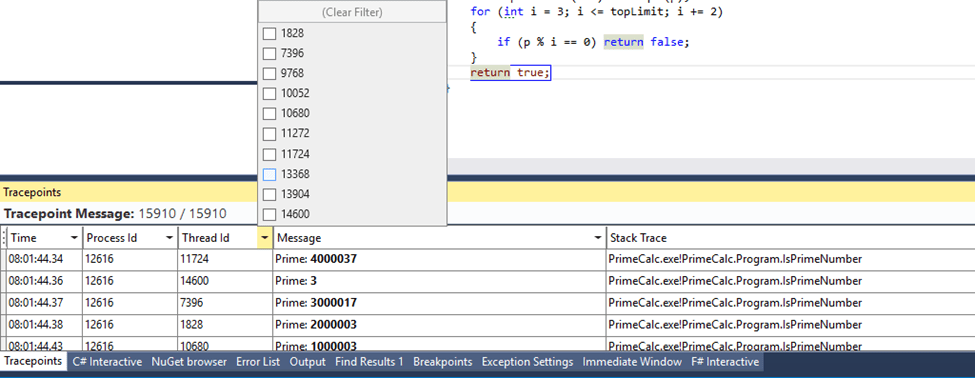
When you filter one thread, you can get only the messages that come from that thread:
The other thing that is nice is the stack trace. I always have the question: “How did the code reached here?”. The stack trace answers this:
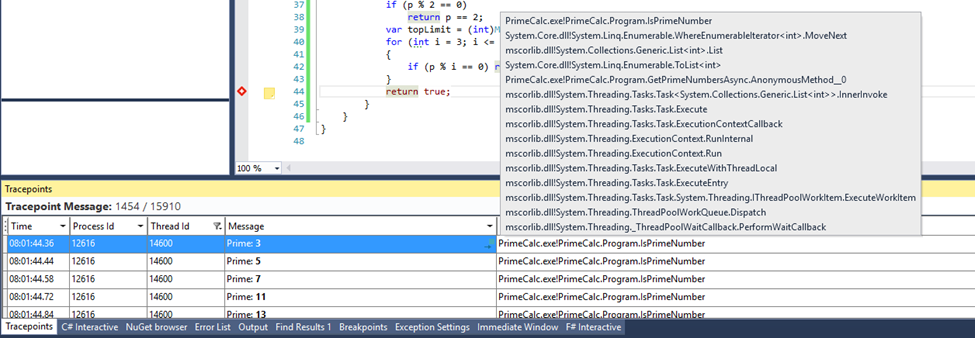
Nice, no?
Swami sees all, the past and the future
If you take a look at the figure below, you will see a glimpse of the past and the future:
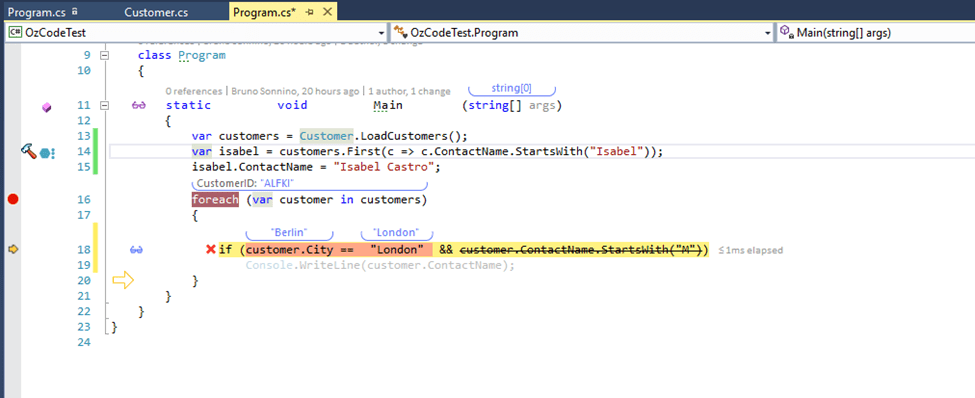
Just above line 16, you will see that we are working with the “ALFKI” customer. In line 18, you can see that the customer’s city is Berlin. OzCode will show you the following line dimmed – that line won’t be executed and the execution will go to line 20, where there is the arrow. You can also see that the second part of the If won’t be executed (it’s crossed out). You also can see the red X near the line, indicating it is false. If you click on the glasses near the line, you will see more info:
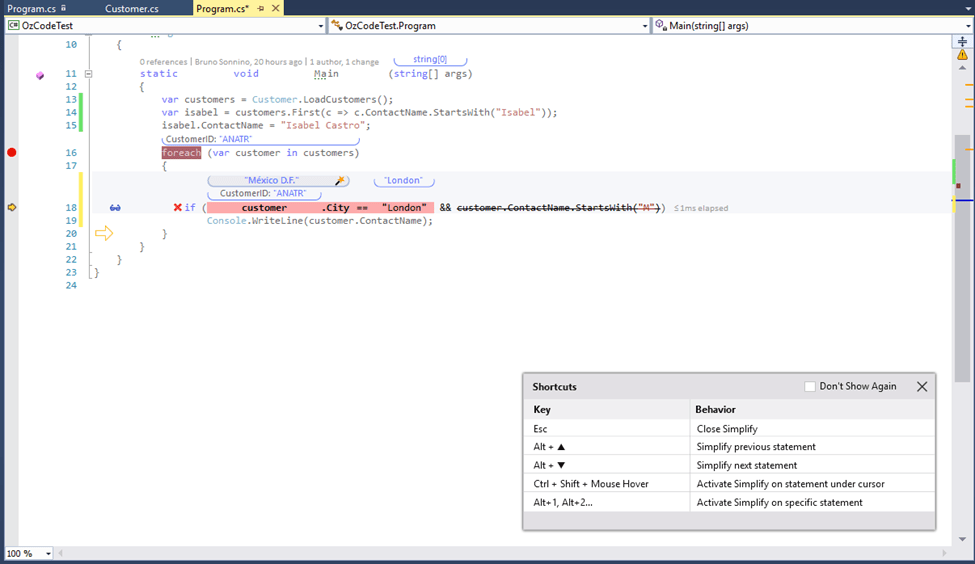
You can have a lot of info about your data and how you reached there.
Exception handling
One thing that bothers me regarding exceptions is when I get an exception buried inside a bunch of Inner Exceptions. I must drill down the exception until I find something that is valuable. OzCode makes this a lot easier: when an exception is thrown, something like this one is shown:
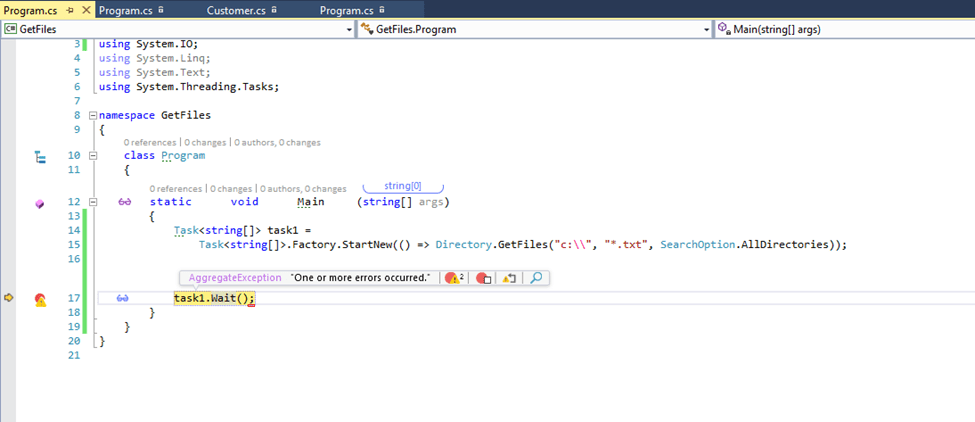
You can see the exception that occurred above the line (in the code, above line 17), with four icons:
-
The first one will open the exception box – it is showing that there are two nested exceptions
-
The second one will toggle break in this kind of exception
-
The third one will go to the line where the exception occurred
-
The fourth one will search for help on Google, StackOverflow, Yahoo or Bing
If you click on the first icon or in the icon on the left of the line, it will open the exception box:
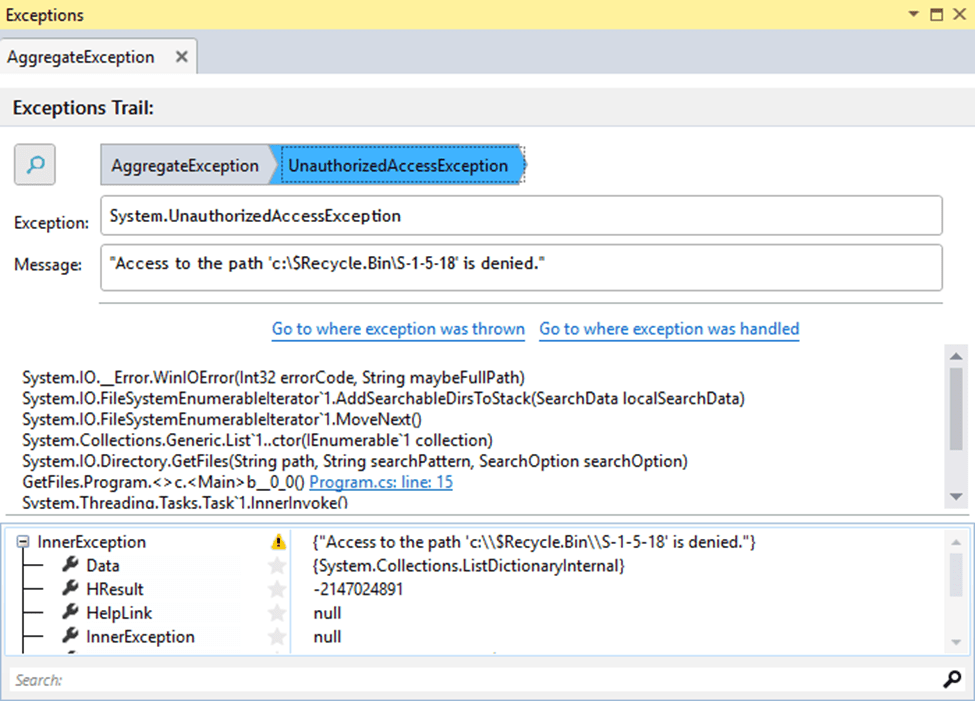 On the top, you will see a breadcrumb of the exception. You can click on any exceptions there and it will show you all the data for that exception and you can go to where the exception was thrown or where the exception was handled. You can also search for help in this window. Another exception helper is the exception prediction. If you are stepping through code that will generate an exception, you get something like this:
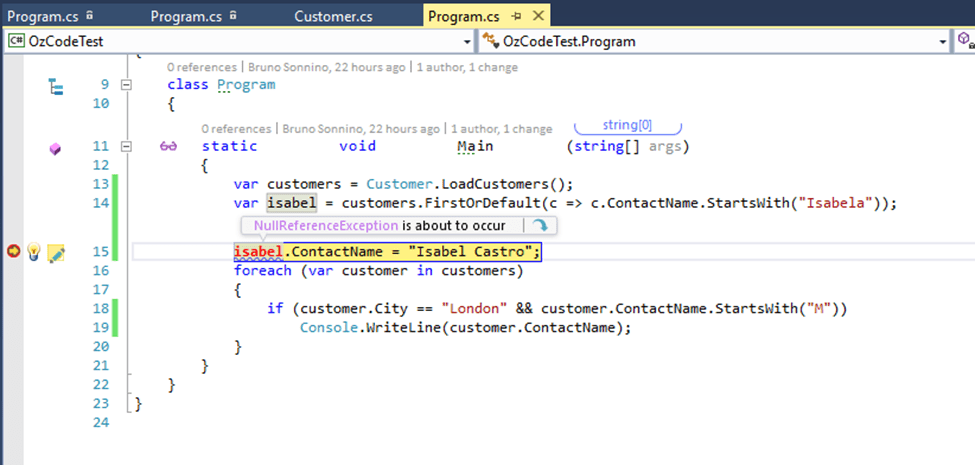
You can click on the icon and skip the line, thus not throwing the exception or, if you are using Visual studio 2015, you can even edit the code and continue:
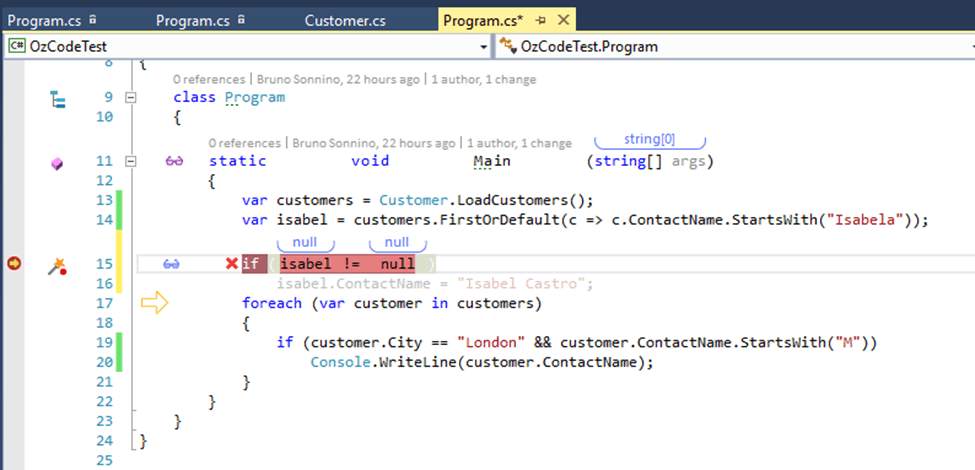 That’s really a great way to make your code more solid proof!
Conclusion
As you can see, OzCode gives you a lot of help for your debugging, I received a free copy due to the fact I’m a Microsoft MVP, but I really enjoy using it. If you want to try it by yourself, you can download a free version at http://oz-code.com. Happy debugging!
1 thought on “Debugging with OzCode”