Some time ago, I’ve written an article about analyzing disk space using Excel and Powershell. While these tools are very easy to use and very flexible, that requires some organization: you must run a Powershell script, open the resulting file in Excel and run the analysis. To do that, I prefer to run a single command and have the data on my hands with no extra operations. So, I decided to create a WPF program to get the disk data and show it.
Getting Disk Information
The way to get disk information on .NET is to use the method GetFiles of the DirectoryInfo class, like this:
 var di = new DirectoryInfo(selectedPath);
 var files = di.GetFiles("*",SearchOption.AllDirectories);
Then, we can add the files to a DataGrid and show them, but I’d like to get only the largest files and just some data. The best option for that is to use Linq. So, I decided to use Linq to get the same info and show it on the window.
The first step is to get the initial folder and start the enumeration. WPF doesn’t have a native folder selection , but that can be solved with the brave open source developers out there. I installed WPFFolderBrowser (http://wpffolderbrowser.codeplex.com) using the Nuget Package Manager (just right click on the References node in the solution explorer and select Manage NuGet packages and type WPFFolderBrowser on the search box).
Then, I added the basic UI for the window. I used a TabControl with three tabs and a button at the top to select the folder and start the search:
<Grid>
    <Grid.RowDefinitions>
        <RowDefinition Height="40"/>
        <RowDefinition Height="*"/>
    </Grid.RowDefinitions>
    <StackPanel Orientation="Horizontal" HorizontalAlignment="Left" Margin="5">
        <TextBlock Text="Minimum size:" VerticalAlignment="Center" Margin="0,0,5,0"/>
        <TextBox Width="150" x:Name="MinSizeBox" Text="1048576" VerticalContentAlignment="Center"/>
    </StackPanel>
    <Button Width="85" Height="30" Content="Start" Click="StartClick"/>
    <TabControl Grid.Row="1">
        <TabItem Header="File Data">
            <Grid>
                <Grid.RowDefinitions>
                    <RowDefinition Height="*"/>
                    <RowDefinition Height="30"/>
                </Grid.RowDefinitions>
                <ListBox x:Name="FilesList">

                </ListBox>
                <StackPanel Grid.Row="1" Orientation="Horizontal">
                    <TextBlock x:Name="TotalFilesText" Margin="5,0" VerticalAlignment="Center"/>
                    <TextBlock x:Name="LengthFilesText" Margin="5,0" VerticalAlignment="Center"/>
                </StackPanel>
            </Grid>
        </TabItem>
        <TabItem Header="Extensions">
            <Grid>
                <Grid.ColumnDefinitions>
                    <ColumnDefinition Width="*"/>
                    <ColumnDefinition Width="*"/>
                </Grid.ColumnDefinitions>
                <ListBox x:Name="ExtList">

                </ListBox>
            </Grid>
        </TabItem>
        <TabItem Header="ABC Curve">
            <Grid>
                <Grid.ColumnDefinitions>
                    <ColumnDefinition Width="*"/>
                    <ColumnDefinition Width="*"/>
                </Grid.ColumnDefinitions>
                <ListBox x:Name="AbcList">

                </ListBox>
            </Grid>
        </TabItem>
    </TabControl>
</Grid>

The code for the start button is:
private void StartClick(object sender, RoutedEventArgs e)
{
    var fbd = new WPFFolderBrowserDialog();
    if (fbd.ShowDialog() != true)
        return;
    var selectedPath = fbd.FileName;
    var di = new DirectoryInfo(selectedPath);
    Int64 minSize;
    if (!Int64.TryParse(MinSizeBox.Text, out minSize))
        return;
    var files = di.GetFiles("*", SearchOption.AllDirectories)
        .Where(f => f.Length >= minSize)
        .Select(f => new {f.Name, f.Length, f.DirectoryName, f.FullName, f.Extension})
        .OrderByDescending(f => f.Length)
        .ToList();
    var totalSize = files.Sum(f => f.Length);
    TotalFilesText.Text = $"# Files: {files.Count}";
    LengthFilesText.Text = $"({totalSize:N0} bytes)";
    FilesList.ItemsSource = files;
}
This code shows the folder selection dialog. If the user selects a file, it creates a DirectoryInfo and then uses GetFiles to enumerate the files in the folder and its subfolders. I am using Linq to select only the files with size greater than the minimum size, select only the data I want and sort the resulting files by length. At the end, I am converting the enumeration to a list. I am doing that because this list will be traversed some times to get the data by extension or the ABC curve, and I wanted to avoid multiple enumeration.
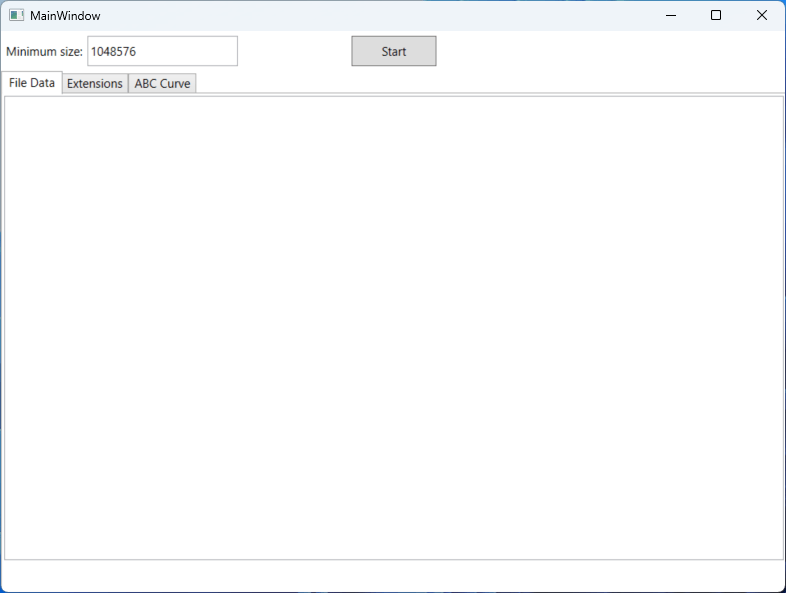
If you run this code and click the start button, you will see that, after some time, the data is shown in the main window:

But that’s not what we want. We want a better display for the data, so we need to create an ItemTemplate for the list:
<ListBox x:Name="FilesList">
    <ListBox.ItemTemplate>
        <DataTemplate>
            <StackPanel>
                <TextBlock Text="{Binding FullName}"/>
                <TextBlock Text="{Binding Length, StringFormat=N0}"/>
            </StackPanel>
        </DataTemplate>
    </ListBox.ItemTemplate>
</ListBox>
And now we have the data shown in a better way:

We can use Linq to fill the other tabs:
private void StartClick(object sender, RoutedEventArgs e)
{
    var fbd = new WPFFolderBrowserDialog();
    if (fbd.ShowDialog() != true)
        return;
    var selectedPath = fbd.FileName;
    var di = new DirectoryInfo(selectedPath);
    Int64 minSize;
    if (!Int64.TryParse(MinSizeBox.Text, out minSize))
        return;
    var files = di.GetFiles("*", SearchOption.AllDirectories)
        .Where(f => f.Length >= minSize)
        .Select(f => new {f.Name, f.Length, f.DirectoryName, f.FullName, f.Extension})
        .OrderByDescending(f => f.Length)
        .ToList();
    var totalSize = files.Sum(f => f.Length);
    TotalFilesText.Text = $"# Files: {files.Count}";
    LengthFilesText.Text = $"({totalSize:N0} bytes)";
    FilesList.ItemsSource = files;
    ExtList.ItemsSource = files.GroupBy(f => f.Extension)
        .Select(g => new {Extension = g.Key, Quantity = g.Count(), Size = g.Sum(f => f.Length)})
        .OrderByDescending(t => t.Size);
    var tmp = 0.0;
    AbcList.ItemsSource = files.Select(f =>
        {
            tmp += f.Length;
            return new {f.Name, Percent = tmp/totalSize*100};
        });
}
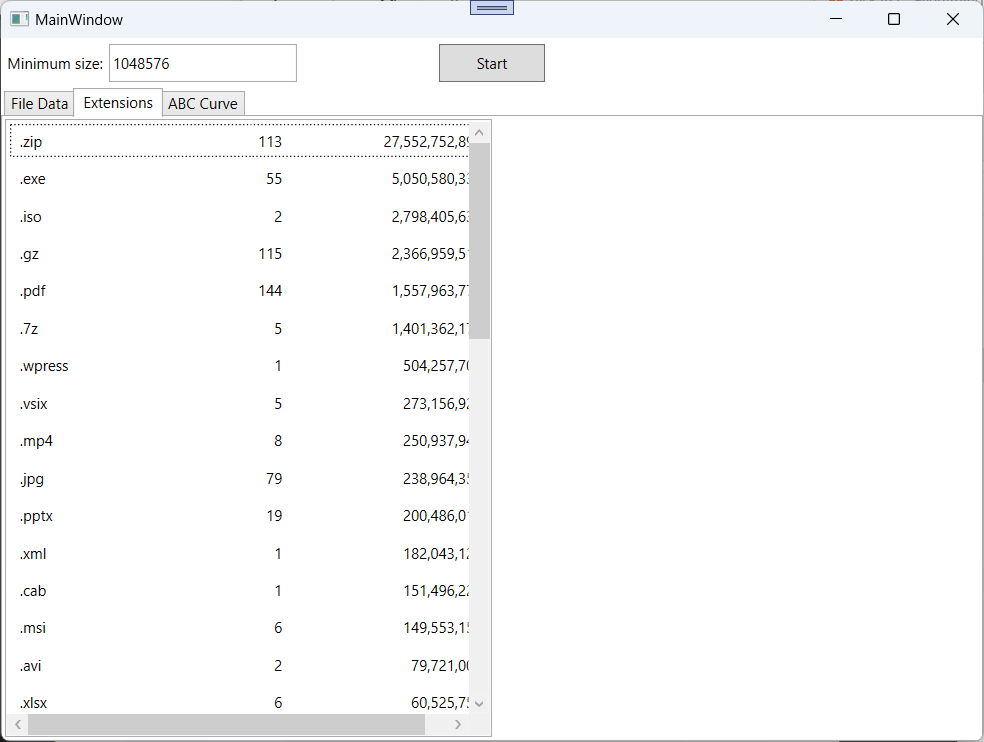
For the extension list, we made a grouping by extension and selected the data we want, getting the quantity and total length for each group. For the ABC curve, we used a temporary value to get the total length for the files larger than the selected one. If you run the program, you will see that the data is not formatted. We can format the data by using the ItemTemplate for the lists:
<TabItem Header="Extensions">
    <Grid>
        <Grid.ColumnDefinitions>
            <ColumnDefinition Width="*"/>
            <ColumnDefinition Width="*"/>
        </Grid.ColumnDefinitions>
        <ListBox x:Name="ExtList">
            <ListBox.ItemTemplate>
                <DataTemplate>
                    <StackPanel Orientation="Horizontal">
                        <TextBlock Text="{Binding Extension}" Width="100" Margin="5"/>
                        <TextBlock Text="{Binding Quantity, StringFormat=N0}" Width="100" Margin="5" TextAlignment="Right"/>
                        <TextBlock Text="{Binding Size,StringFormat=N0}" Width="150" Margin="5" TextAlignment="Right"/>
                    </StackPanel>
                </DataTemplate>
            </ListBox.ItemTemplate>
        </ListBox>
    </Grid>
</TabItem>
<TabItem Header="ABC Curve">
    <Grid>
        <Grid.ColumnDefinitions>
            <ColumnDefinition Width="*"/>
            <ColumnDefinition Width="*"/>
        </Grid.ColumnDefinitions>
        <ListBox x:Name="AbcList">
            <ListBox.ItemTemplate>
                <DataTemplate>
                    <StackPanel Orientation="Horizontal">
                        <TextBlock Text="{Binding Name}" Width="250" Margin="5"/>
                        <TextBlock Text="{Binding Percent, StringFormat=N2}" Width="100" TextAlignment="Right"/>
                    </StackPanel>
                </DataTemplate>
            </ListBox.ItemTemplate>
        </ListBox>
    </Grid>
</TabItem>
When we run the program, we can see the data for the extensions and the ABC Curve:


Now we need only to add the charts to the window.
Adding Charts
We will add the WPF Toolkit (https://wpf.codeplex.com/releases/view/40535) to get the charts, but, as it doesn’t seem to be maintained anymore, I’ll use a fork of this project that has a NuGet package and is at https://github.com/dotnetprojects/WpfToolkit.
To add the Pie Chart on the Extensions page, we must add this XAML code:
<chartingToolkit:Chart Title="Extensions"
               Grid.Row="0"
               Grid.Column="1"
               HorizontalAlignment="Stretch"
               VerticalAlignment="Stretch">
    <chartingToolkit:PieSeries DependentValuePath="Size"
                       IndependentValuePath="Extension"
                       x:Name="ExtSeries" />
</chartingToolkit:Chart>
We must add the namespace at the top of the file:
xmlns:chartingToolkit="clr-namespace:System.Windows.Controls.DataVisualization.Charting;assembly=DotNetProjects.DataVisualization.Toolkit"
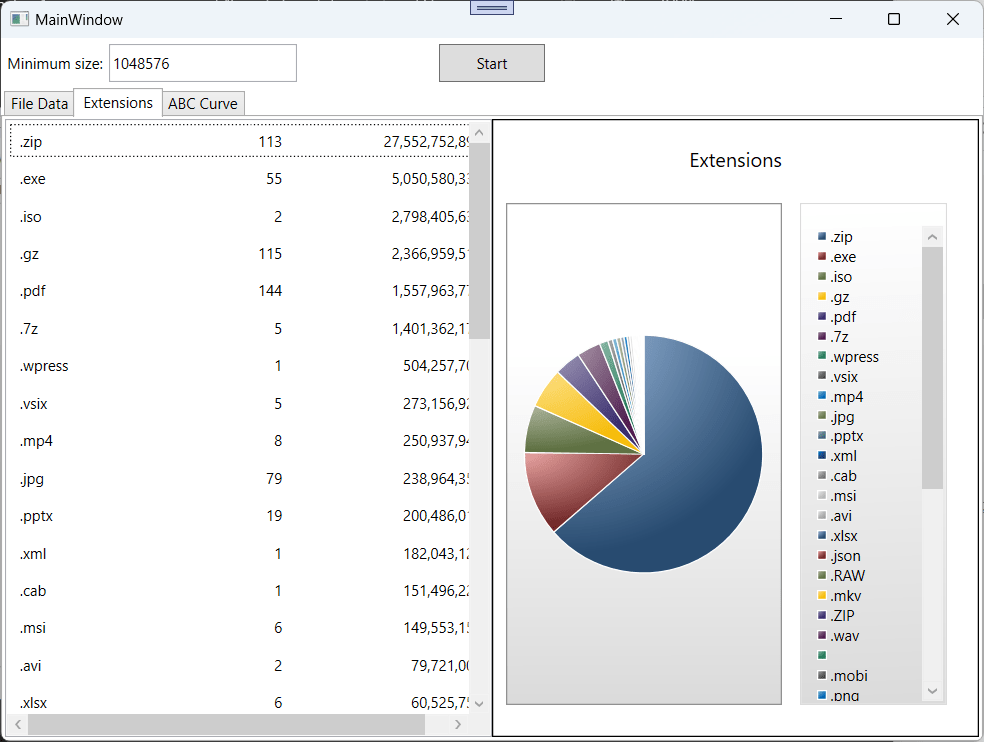
When we run the application, we see the data and the chart, side by side:
 g
g
For the ABC Curve, we must add this XAML:
<chartingToolkit:Chart Title="Abc Curve"
               Grid.Row="0"
               Grid.Column="1"
               HorizontalAlignment="Stretch"
               VerticalAlignment="Stretch">
    <chartingToolkit:Chart.Axes>
        <chartingToolkit:CategoryAxis Orientation="X" ShowGridLines="False"  />
        <chartingToolkit:LinearAxis Title="% Size"
                                 Orientation="Y"
                                 ShowGridLines="True" />
    </chartingToolkit:Chart.Axes>
    <chartingToolkit:LineSeries DependentValuePath="Percent"
                        IndependentValuePath="Item"
                        x:Name="AbcSeries" />
</chartingToolkit:Chart>
Then, we change the source code to assign the data for the series:
private void StartClick(object sender, RoutedEventArgs e)
{
    var fbd = new WPFFolderBrowserDialog();
    if (fbd.ShowDialog() != true)
        return;
    var selectedPath = fbd.FileName;
    var di = new DirectoryInfo(selectedPath);
    Int64 minSize;
    if (!Int64.TryParse(MinSizeBox.Text, out minSize))
        return;
    var files = di.GetFiles("*", SearchOption.AllDirectories)
        .Where(f => f.Length >= minSize)
        .Select(f => new {f.Name, f.Length, f.DirectoryName, f.FullName, f.Extension})
        .OrderByDescending(f => f.Length)
        .ToList();
    var totalSize = files.Sum(f => f.Length);
    TotalFilesText.Text = $"# Files: {files.Count}";
    LengthFilesText.Text = $"({totalSize:N0} bytes)";
    FilesList.ItemsSource = files;
    var extensions = files.GroupBy(f => f.Extension)
        .Select(g => new {Extension = g.Key, Quantity = g.Count(), Size = g.Sum(f => f.Length)})
        .OrderByDescending(t => t.Size).ToList();
    ExtList.ItemsSource = extensions;
    ExtSeries.ItemsSource = extensions;
    var tmp = 0.0;
    var abcData = files.Select(f =>
    {
        tmp += f.Length;
        return new {f.Name, Percent = tmp/totalSize*100};
    }).ToList();
    AbcList.ItemsSource = abcData;
    AbcSeries.ItemsSource = abcData.OrderBy(d => d.Percent).Select((d,i) => new {Item = i, d.Percent});
}
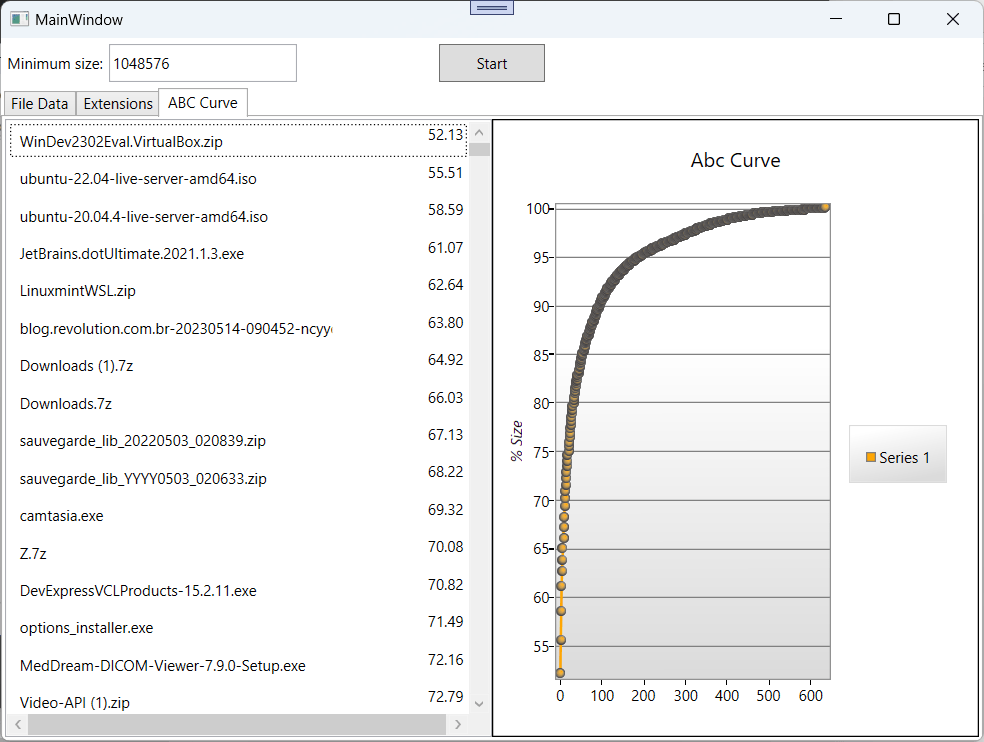
When we run the code, we can see the ABC curve.

Conclusion
As you can see, it’s fairly easy to get the disk space in a WPF program. With some Linq queries, we can analyze the data the way we want, and then present it using the WPF visualization.
The full source code for this project is at https://github.com/bsonnino/DiskAnalysis
